
Observing My Kubernetes Cluster with Headlamp
I've written a lot about what's running on my Kubernetes cluster -- Envoy Gateway, hardened container images, network policies, Let's Encrypt TLS -- but I've never written about how I actually observe it. How do I know my nodes are healthy? How do I see CPU and memory usage? How do I watch CronJobs complete? For a while, the answer was kubectl and nothing else. That changed when I found Headlamp and started pairing it with k9s.
What is Headlamp?
Headlamp is an open source Kubernetes web UI, currently a CNCF Sandbox project under Kubernetes SIG UI. It's available both as an in-cluster deployment (accessed via browser) and as a desktop application that reads your local kubeconfig. It's vendor-agnostic, extensible via plugins, and uses your existing RBAC permissions -- it doesn't require any special cluster-level access beyond what your user already has.
I'm using the desktop application rather than deploying it in-cluster. This means I don't have to expose another service, manage another deployment, or worry about securing a web UI. Headlamp just reads my kubeconfig and connects to the Kubernetes API server directly. On Linux, I'm using the AppImage distribution. The Flatpak version is also available, but I ran into issues getting it to authenticate with OKE, so the AppImage was the path of least resistance.
The Problem: No Metrics Out of the Box
When I first opened Headlamp and pointed it at my OKE cluster, the UI loaded fine -- I could see nodes, pods, deployments, services, everything. But the CPU and memory columns were empty. Headlamp was telling me it couldn't find a metrics source.
This is because Headlamp relies on the Kubernetes Metrics Server to display resource usage. The Metrics Server is a cluster add-on that collects resource metrics from kubelets and exposes them through the Kubernetes API. It's what powers kubectl top nodes and kubectl top pods. Without it, neither kubectl nor any dashboard can show you how much CPU or memory your workloads are consuming.
OKE doesn't install the Metrics Server by default on Basic clusters. So I had to install it myself.
Installing metrics-server
The Metrics Server project provides a manifest for high-availability deployments on clusters with 1.21+. Since my cluster has 4 nodes across 3 availability domains, the HA deployment made sense. The installation is a single kubectl apply:
kubectl apply -f https://github.com/kubernetes-sigs/metrics-server/releases/latest/download/high-availability-1.21+.yamlAfter waiting for the deployment to become available:
kubectl wait --for=condition=Available --timeout=300s deployment/metrics-server -n kube-systemI could immediately run kubectl top nodes and see real numbers. More importantly, Headlamp's overview page lit up with CPU and memory gauges.
This is part of the deploy.sh script in my dylanmtaylor-kubernetes repository, so it's installed automatically whenever I deploy or redeploy the cluster:
echo "Installing metrics-server in HA mode..."
kubectl apply -f https://github.com/kubernetes-sigs/metrics-server/releases/latest/download/high-availability-1.21+.yaml
kubectl wait --for=condition=Available --timeout=300s deployment/metrics-server -n kube-system
Adding Prometheus with kube-prometheus-stack
Metrics Server gives you point-in-time resource usage, but it doesn't store historical data. If I want to know what my cluster's memory usage looked like yesterday, or whether a node was under pressure before a pod got evicted, I need something that scrapes and stores metrics over time.
The kube-prometheus-stack Helm chart bundles Prometheus, Alertmanager, Grafana, and a set of pre-configured recording rules and alerts for Kubernetes. It's the standard way to get full observability into a Kubernetes cluster. I deploy it via Helm in my deploy script:
helm repo add prometheus-community https://prometheus-community.github.io/helm-charts
helm install kube-prometheus-stack prometheus-community/kube-prometheus-stack \
    --namespace monitoring \
    --create-namespace \
    -f helm-values/kube-prometheus-stack.yaml \
    --wait \
    --timeout 600s
My Helm values file is minimal -- I'm just overriding the Prometheus Operator image to pull from the upstream Quay registry:
prometheusOperator:
  image:
    registry: quay.io
    repository: prometheus-operator/prometheus-operator
This gives me Prometheus scraping all the standard Kubernetes metrics (node resource usage, pod resource usage, API server latency, etcd health, etc.), Alertmanager for routing alerts, and Grafana with pre-built dashboards for cluster and workload monitoring. The whole stack deploys into the monitoring namespace and runs alongside my application workloads.
On a cluster with 4 nodes at 1 OCPU and 6 GiB RAM each, the monitoring stack is the heaviest thing running. It's worth it for the visibility it provides, but if you're on tighter resources, you could skip Grafana and Alertmanager and run a standalone Prometheus with just the recording rules.
What Headlamp Shows Me
With metrics-server and kube-prometheus-stack deployed, Headlamp becomes genuinely useful as a day-to-day cluster dashboard. Here's what the cluster overview looks like:
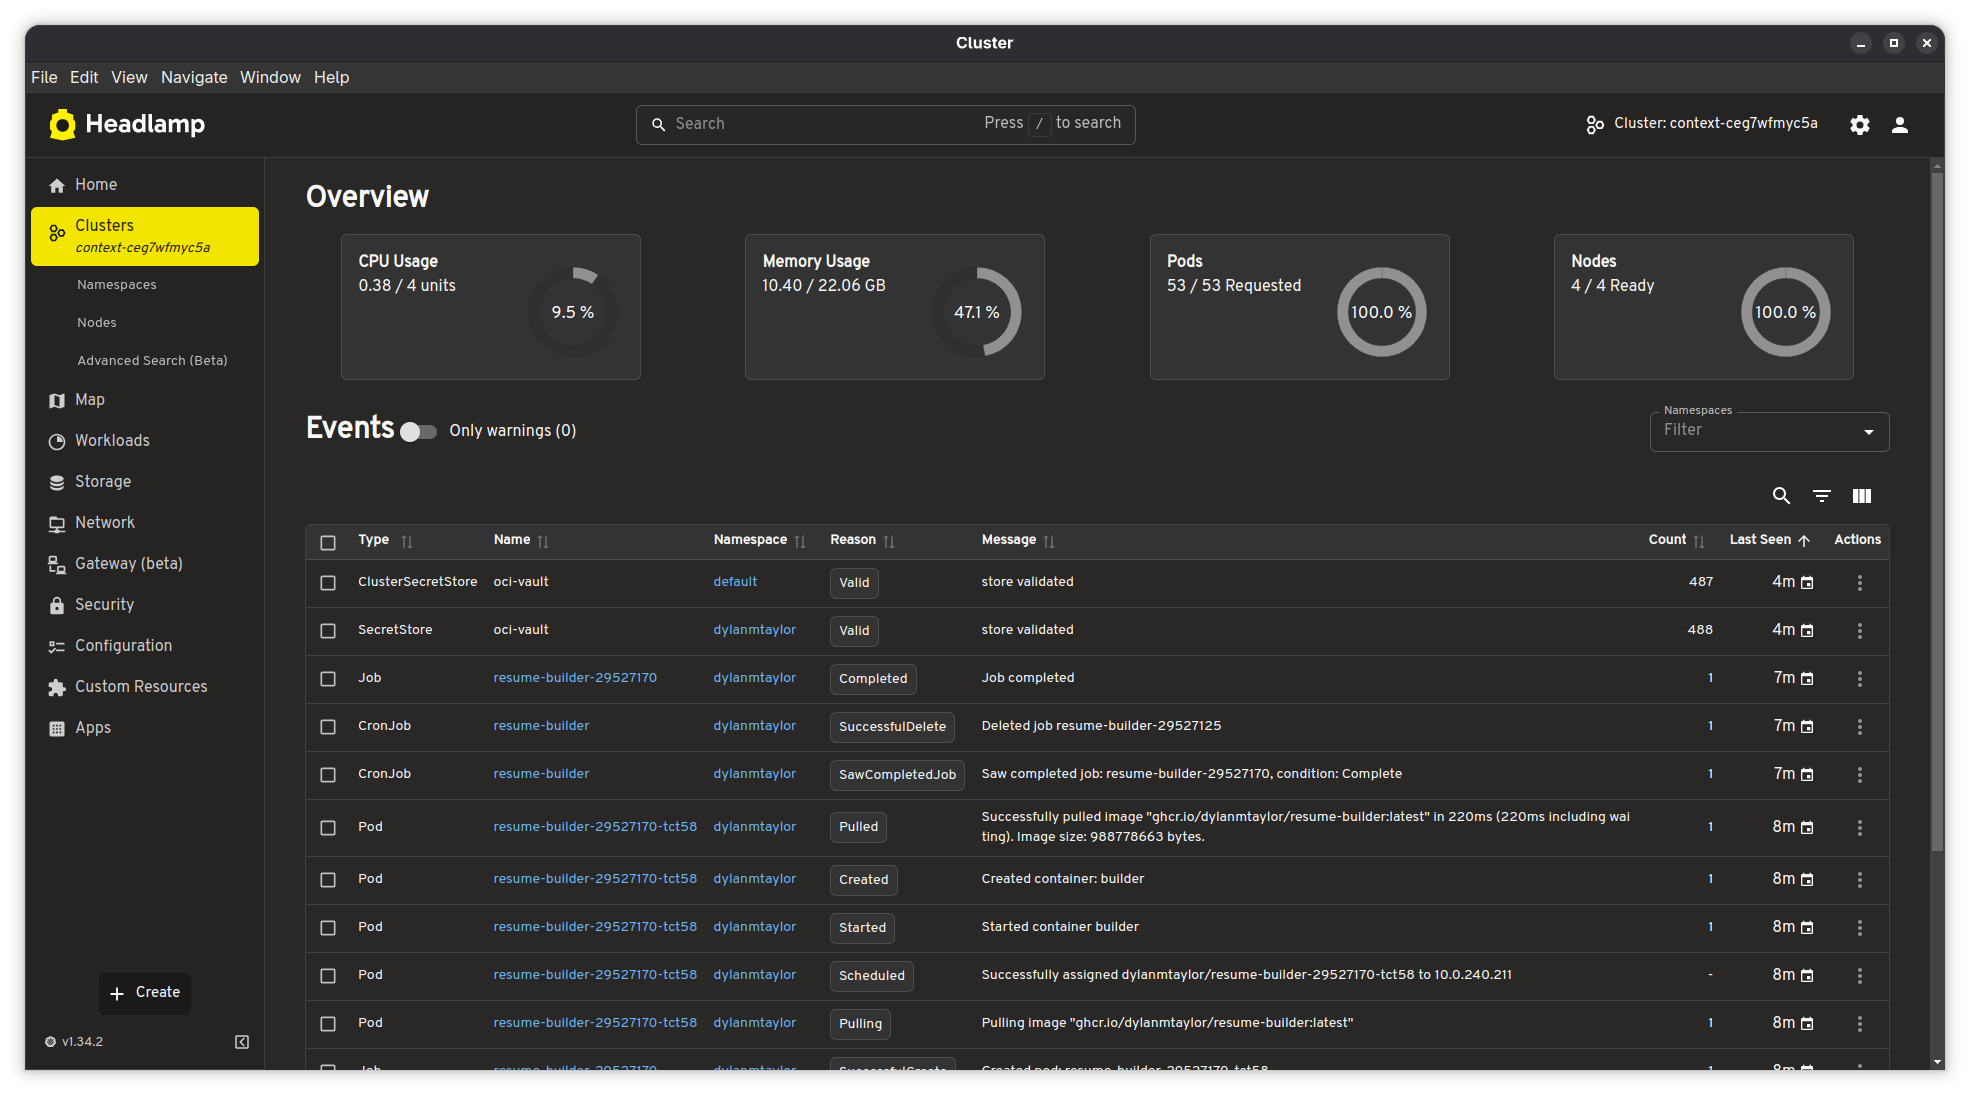
The overview page gives me four gauges at a glance: CPU usage (0.38 / 4 units, 9.5%), memory usage (10.40 / 22.06 GiB, 47.1%), pod count (53 / 53 requested), and node readiness (4 / 4 ready, 100%). Below that is a live event stream filtered to warnings by default. I can see my resume-builder CronJob completing its latest run -- the image pull, container creation, job completion, and cleanup all visible in the event log.
The nodes view shows each node's individual CPU and memory utilization with bar charts, along with readiness status, Kubernetes version, and age:
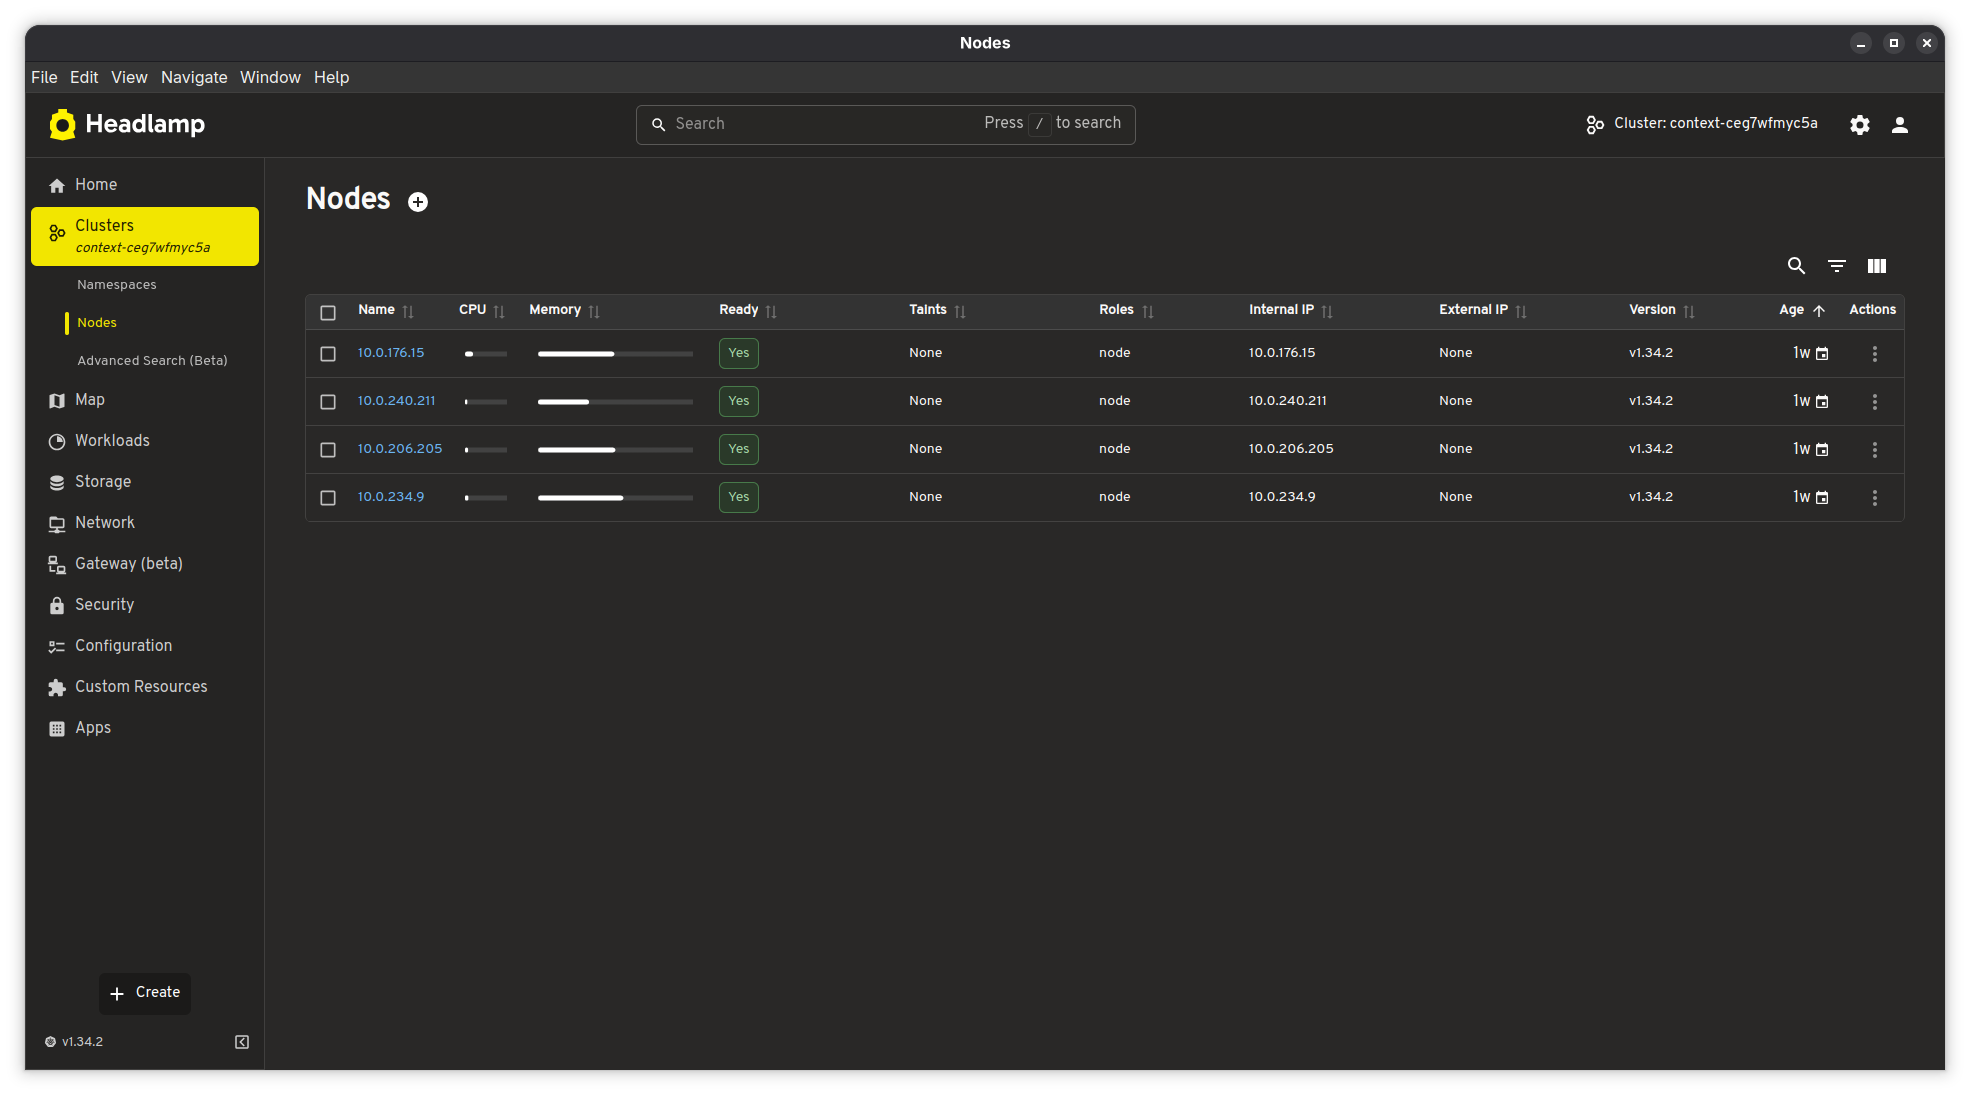
All 4 nodes are running Kubernetes v1.34.2 on private IPs (10.0.x.x) with no external IPs -- they're in a private subnet behind a NAT gateway, as they should be. The nodes are about a week old, which lines up with when I last updated the node pool image.
The left sidebar gives quick access to everything else: workloads (deployments, pods, CronJobs, DaemonSets), storage, networking, Gateway API resources (beta), security (RBAC, service accounts, network policies), configuration (ConfigMaps, secrets), and custom resources. Headlamp understands Gateway API resources natively, which is nice since I'm using Envoy Gateway -- I can inspect my Gateway and HTTPRoute objects directly in the UI.
When I Need a Terminal: k9s
Headlamp is great for getting the big picture, but when something goes wrong and I need to actually dig in -- check pod logs, poke around inside a container, figure out why something isn't starting -- I reach for k9s. It's a terminal-based Kubernetes UI, and it's fast. I can navigate to a pod and press l to tail its logs in real time, or press s to drop into a shell session right there. No more chaining kubectl logs -f and kubectl exec -it commands back and forth. For the kind of quick, hands-on debugging where I just need to see what's happening inside a pod right now, k9s is hard to beat.
I tend to use both tools depending on what I'm doing. Headlamp stays open when I want to keep an eye on the cluster -- check resource usage, watch events, see if everything's healthy. k9s comes out when I need to actually interact with something. They complement each other well.
Why Headlamp Over Alternatives
I've used the Kubernetes Dashboard (the official one) in the past, and it works, but it requires deploying it in-cluster and dealing with authentication tokens or proxy setups. I've also used Lens, which was great until it became a commercial product with telemetry and account requirements. Headlamp hits the sweet spot:
- It's 100% open source under Apache 2.0, maintained under Kubernetes SIG UI
- The desktop app reads my kubeconfig directly -- no in-cluster deployment needed
- It respects RBAC, so it only shows what my user has permission to see
- It has native Gateway API support (beta), which most alternatives lack
- It's extensible via plugins if I ever need custom functionality
- It doesn't phone home or require an account
The dark theme is also easy on the eyes for late-night cluster debugging sessions.
The Full Observability Stack
To summarize, here's what I have deployed for observability on my OKE cluster:
| Component | Purpose | Namespace |
|---|---|---|
| metrics-server (HA) | Real-time CPU/memory metrics for nodes and pods | kube-system |
| Prometheus | Metric scraping and time-series storage | monitoring |
| Alertmanager | Alert routing and notification | monitoring |
| Grafana | Dashboards and visualization | monitoring |
| Prometheus Operator | Manages Prometheus/Alertmanager lifecycle | monitoring |
| Headlamp (desktop) | Kubernetes UI with live cluster overview | Local (AppImage) |
| k9s (terminal) | Pod logs, shell access, and resource navigation | Local (terminal) |
On top of this, OCI provides its own monitoring layer -- Cloud Guard for security scanning, log groups for email delivery and instance security events, and the OKE console for cluster-level operations. Between the in-cluster Prometheus stack, Headlamp, k9s, and OCI's native monitoring, I've got pretty solid visibility into what's happening across the infrastructure.
All of the cluster configuration, including the Helm values and deploy script, is available in my Kubernetes infrastructure repository.